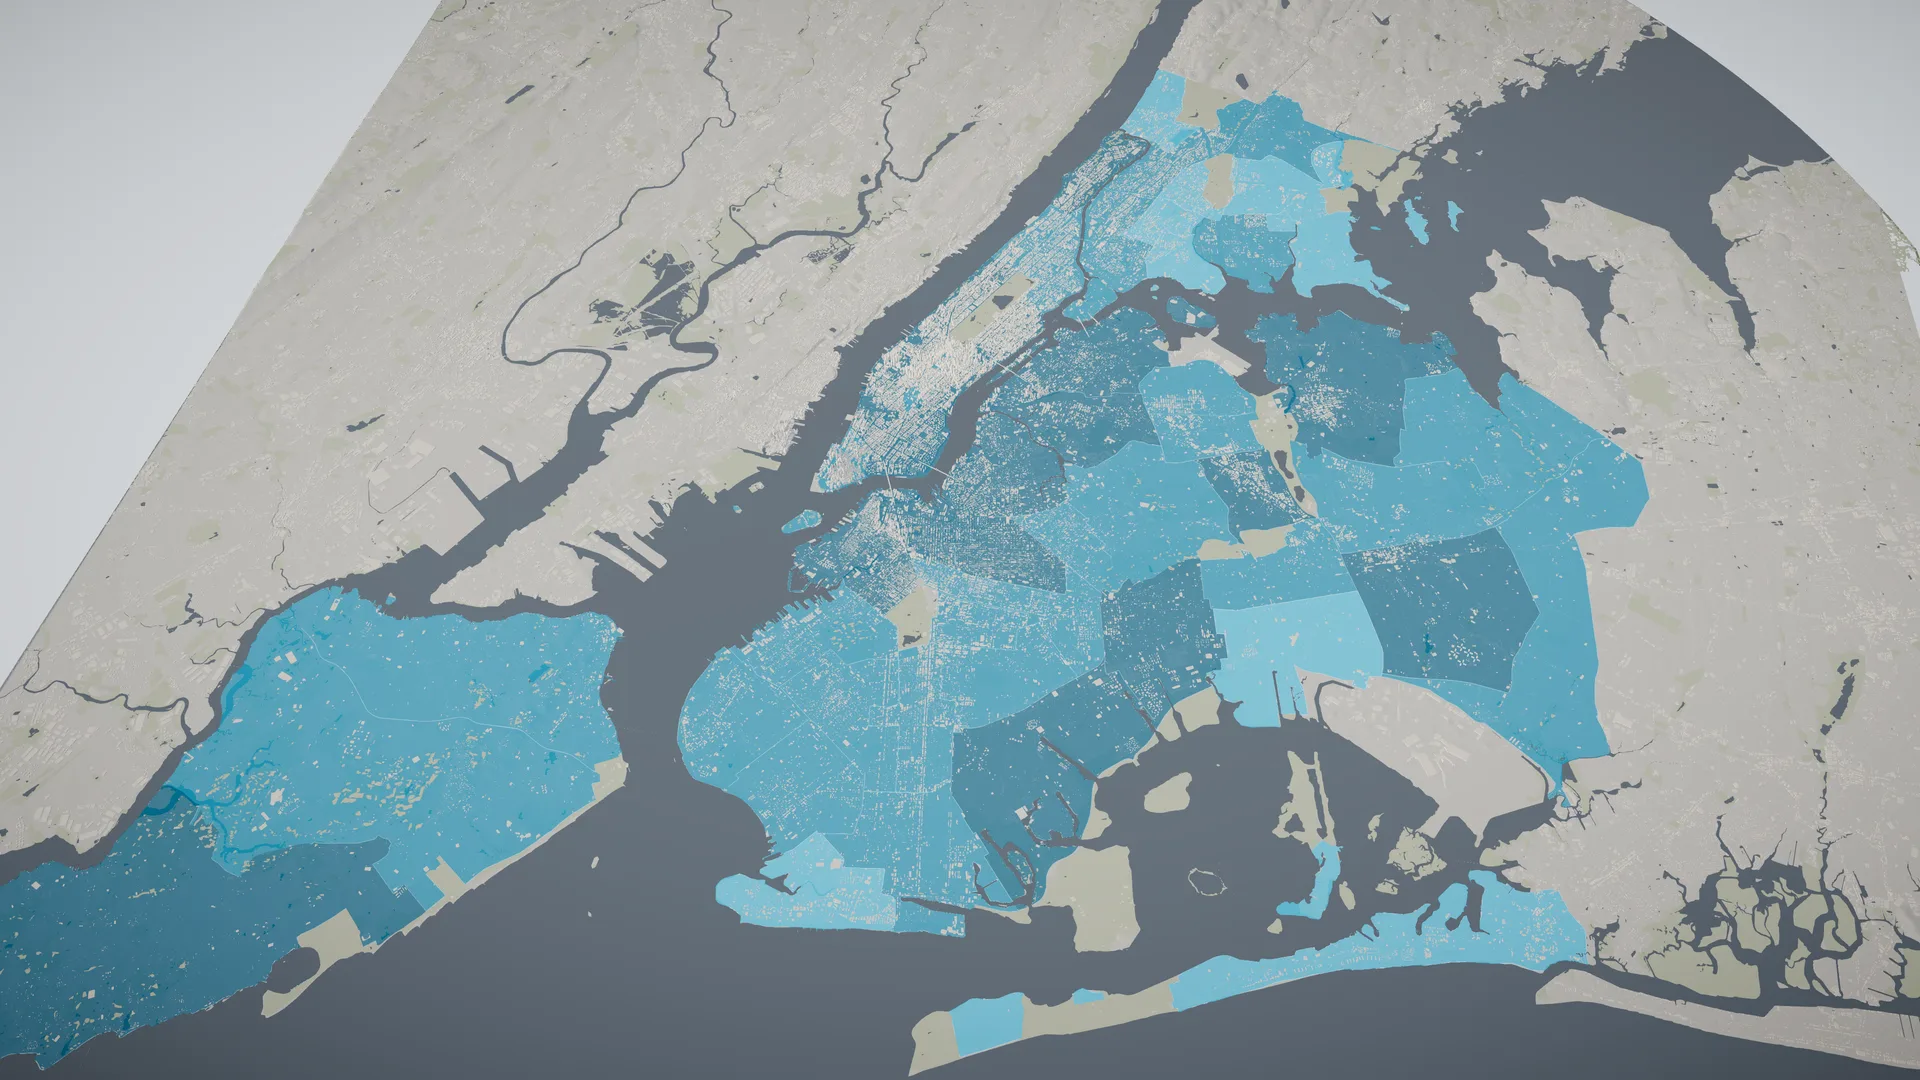
The targets
Local Law 167 of 2023 requires New York City to set housing production targets every five years. The first set is in the final Fair Housing Growth Strategy from the Department of Housing Preservation and Development and the Department of City Planning, dated October 8, 2026. The report estimates that the city needs about 700,000 more homes over ten years, and it sets a target of 350,000 new homes by the end of 2030, 85,000 of them income-restricted affordable homes. Each of the 59 community districts gets its own share, with affordable, deeply affordable and homeless-household targets inside it.
The targets start from how fast each district grew from 2016 to 2025. The report sorts the districts into three groups. The fastest growers are asked for 9 percent growth over five years and the middle group for 8 percent. The slowest are asked for their own past rate plus 6.25 percentage points. Each district’s rate is then raised by up to a tenth for the share of its land near rail transit, and cut by up to a fifth for the share likely to flood at high tide by the 2080s. Those two steps were added after comments on the August draft.
Homes count toward a target when they get a certificate of occupancy between January 1, 2026 and December 31, 2030, and homes lost to demolitions or combinations count against it. A rezoning on its own counts for nothing.
Where the homes went, and where they’re asked for
Adding up the report’s district figures, the city gained 167,045 net new homes from 2021 to 2025, and half of them went up in 11 of the 59 districts. Downtown Brooklyn and Fort Greene added 12,170, Long Island City, Sunnyside and Woodside 12,150, and Williamsburg and Greenpoint 11,670.
The targets spread the next five years much more evenly: half of the 350,000 falls on 23 districts. Six districts are asked for fewer homes than they have just added, and they include the three biggest builders. Downtown Brooklyn’s target is 7,980, against the 12,170 it added. At the other end, Canarsie’s target is 32 times what it built.
All 59 districts as a table
| Rank | District | Added, 2021–25 | 2030 target | Step up |
|---|---|---|---|---|
| 1 | BK18 Canarsie, Flatlands | 190 | 6,090 | 32.1× |
| 2 | QN13 Queens Village, Bellerose, Rosedale | 285 | 5,600 | 19.6× |
| 3 | QN10 South Ozone Park & Howard Beach | 210 | 3,620 | 17.2× |
| 4 | BK10 Bay Ridge, Dyker Heights | 305 | 4,060 | 13.3× |
| 5 | MN7 Upper West Side | 835 | 10,735 | 12.9× |
| 6 | MN2 Greenwich Village, Tribeca | 500 | 6,360 | 12.7× |
| 7 | SI2 Mid-Island | 420 | 4,605 | 11.0× |
| 8 | MN8 Upper East Side, Roosevelt Island | 1,285 | 13,515 | 10.5× |
| 9 | QN9 Kew Gardens, Richmond Hill, Woodhaven | 495 | 4,985 | 10.1× |
| 10 | QN11 Auburndale, Bayside, Douglaston | 445 | 4,305 | 9.7× |
| 11 | BK15 Sheepshead Bay, Gravesend (East) | 570 | 5,385 | 9.4× |
| 12 | QN5 Ridgewood, Maspeth, Middle Village | 605 | 5,340 | 8.8× |
| 13 | BX10 Co-op City, Throgs Neck | 540 | 3,945 | 7.3× |
| 14 | SI3 South Shore | 985 | 6,575 | 6.7× |
| 15 | BK12 Borough Park, Kensington | 850 | 5,505 | 6.5× |
| 16 | QN8 Fresh Meadows, Hillcrest, Briarwood | 1,015 | 5,890 | 5.8× |
| 17 | QN4 Elmhurst, Corona | 875 | 5,065 | 5.8× |
| 18 | SI1 North Shore | 1,045 | 5,670 | 5.4× |
| 19 | BK11 Bensonhurst, Bath Beach | 1,095 | 5,795 | 5.3× |
| 20 | MN6 East Midtown | 1,820 | 8,905 | 4.9× |
| 21 | QN3 Jackson Heights, East Elmhurst | 985 | 4,740 | 4.8× |
| 22 | BX11 Pelham Parkway, Morris Park | 765 | 3,680 | 4.8× |
| 23 | MN3 Lower East Side, Chinatown | 1,745 | 7,450 | 4.3× |
| 24 | MN10 Harlem | 1,645 | 5,625 | 3.4× |
| 25 | QN6 Forest Hills, Rego Park | 1,860 | 6,325 | 3.4× |
| 26 | BK7 Sunset Park, Windsor Terrace | 1,590 | 5,235 | 3.3× |
| 27 | BX9 Soundview, Parkchester | 1,875 | 5,990 | 3.2× |
| 28 | QN7 Flushing, Murray Hill, Whitestone | 2,870 | 8,650 | 3.0× |
| 29 | MN9 Morningside Heights, Hamilton Heights | 1,410 | 4,100 | 2.9× |
| 30 | BX8 Riverdale, Kingsbridge, Marble Hill | 1,395 | 3,990 | 2.9× |
| 31 | MN12 Washington Heights, Inwood | 2,570 | 6,805 | 2.6× |
| 32 | MN5 Midtown, Flatiron | 1,770 | 4,390 | 2.5× |
| 33 | BX12 Wakefield, Williamsbridge, Eastchester | 2,570 | 5,490 | 2.1× |
| 34 | MN11 East Harlem | 2,405 | 4,910 | 2.0× |
| 35 | BK14 Flatbush, Midwood | 2,830 | 5,750 | 2.0× |
| 36 | BK6 Park Slope, Carroll Gardens | 3,155 | 6,220 | 2.0× |
| 37 | BK13 Coney Island, Brighton Beach | 2,070 | 3,970 | 1.9× |
| 38 | BK4 Bushwick | 2,720 | 5,005 | 1.8× |
| 39 | MN4 Chelsea, Hell’s Kitchen | 4,925 | 8,865 | 1.8× |
| 40 | BK9 Crown Heights (South) | 2,645 | 4,405 | 1.7× |
| 41 | BK17 East Flatbush | 3,450 | 5,715 | 1.7× |
| 42 | BX2 Longwood, Hunts Point | 1,360 | 2,085 | 1.5× |
| 43 | BK8 Crown Heights (North) | 3,515 | 5,270 | 1.5× |
| 44 | MN1 Financial District | 3,855 | 5,600 | 1.5× |
| 45 | BX3 Morrisania | 2,610 | 3,660 | 1.4× |
| 46 | BX7 Fordham, Bedford Park, Norwood | 4,090 | 5,695 | 1.4× |
| 47 | BK3 Bedford-Stuyvesant | 6,095 | 7,895 | 1.3× |
| 48 | BX4 Highbridge, Concourse | 4,695 | 5,840 | 1.2× |
| 49 | QN12 Jamaica, St. Albans, Hollis | 6,275 | 7,520 | 1.2× |
| 50 | QN1 Astoria, Queensbridge | 8,225 | 9,520 | 1.2× |
| 51 | BK16 Ocean Hill, Brownsville | 3,490 | 4,035 | 1.2× |
| 52 | BK5 East New York, Cypress Hills | 6,735 | 7,730 | 1.1× |
| 53 | BX6 Tremont, Belmont, West Farms | 3,270 | 3,630 | 1.1× |
| 54 | QN14 The Rockaways | 3,575 | 3,540 | 1.0× |
| 55 | BX5 Morris Heights, Mount Hope | 5,190 | 5,080 | 1.0× |
| 56 | BK1 Williamsburg, Greenpoint | 11,670 | 10,165 | 0.9× |
| 57 | QN2 Long Island City, Sunnyside, Woodside | 12,150 | 8,805 | 0.7× |
| 58 | BX1 Melrose, Mott Haven, Port Morris | 6,455 | 4,370 | 0.7× |
| 59 | BK2 Downtown Brooklyn, Fort Greene | 12,170 | 7,980 | 0.7× |
The Fast Track’s 12
On October 1, City Planning named the 12 districts that will get the Affordable Housing Fast Track: a 90-day review for housing rezonings from January 1, 2027, chosen because they added the fewest new affordable homes for their size. The targets report measures something else, every net new home rather than only the affordable ones, and it points to the same places.
Together the 12 added 7,290 homes from 2021 to 2025, 4.4 percent of the city’s. Their 2030 targets add up to 75,015, 21.6 percent of the city’s total, about ten times the pace they have been building at. The five biggest jumps between what a district built and what it is now asked for are all on the list, and nine of the 12 biggest are.
| District | Homes added, 2021–25 | 2030 target | Of which affordable | Step up |
|---|---|---|---|---|
| BK18Canarsie, FlatlandsBrooklyn | 190 | 6,090 | 1,520 | 32.1× |
| QN13Queens Village, Bellerose, RosedaleQueens | 285 | 5,600 | 1,400 | 19.6× |
| QN10South Ozone Park & Howard BeachQueens | 210 | 3,620 | 905 | 17.2× |
| BK10Bay Ridge, Dyker HeightsBrooklyn | 305 | 4,060 | 1,015 | 13.3× |
| MN7Upper West SideManhattan | 835 | 10,735 | 2,685 | 12.9× |
| SI2Mid-IslandStaten Island | 420 | 4,605 | 1,150 | 11.0× |
| MN8Upper East Side, Roosevelt IslandManhattan | 1,285 | 13,515 | 3,380 | 10.5× |
| QN11Auburndale, Bayside, DouglastonQueens | 445 | 4,305 | 1,075 | 9.7× |
| QN5Ridgewood, Maspeth, Middle VillageQueens | 605 | 5,340 | 1,335 | 8.8× |
| SI3South ShoreStaten Island | 985 | 6,575 | 1,645 | 6.7× |
| BK12Borough Park, KensingtonBrooklyn | 850 | 5,505 | 1,375 | 6.5× |
| QN4Elmhurst, CoronaQueens | 875 | 5,065 | 1,265 | 5.8× |
| All 12 | 7,290 | 75,015 | 18,750 | 10.3× |
The Upper West and Upper East Sides
The Upper West Side added 835 homes in five years, and its target is 10,735. The Upper East Side and Roosevelt Island added 1,285, and its 13,515 is the largest target of any district in the city. Between them the two carry 24,250 homes, 7 percent of the citywide total.
Part of the reason is size. A target is a growth rate applied to the homes a district already has, and these two have more homes than any other district on the Fast Track list.
Canarsie and the southern edge
The biggest step up in the city is in Canarsie and Flatlands, which added 190 homes from 2021 to 2025 and is asked for 6,090 by 2030. The next three are also on the Fast Track list: Queens Village, Bellerose and Rosedale (285 added, 5,600 targeted); South Ozone Park and Howard Beach (210 added, 3,620 targeted); Bay Ridge and Dyker Heights (305 added, 4,060 targeted).
Several of these districts run down to Jamaica Bay or the harbor. The report lowers a district’s target in proportion to its land that is likely to flood at high tide by the 2080s, by the full fifth in the Rockaways, so the targets here already allow for that.
What the targets don’t do
The targets are goals, not zoning. Nothing in the report changes what any lot is allowed to hold, and it doesn’t make anything get built. They set out how much housing the city wants, and where.
“Significantly shift course for the districts that have contributed the least.”
The report ties the two lists together itself. It says the Fast Track districts “complement the FHGS by providing a land use tool that can allow those districts to better meet the affordable housing targets established in this report.” In the 12, a rezoning for housing gets a 90-day review from January 1, and the City Planning Commission casts the final vote. Progress is counted in finished homes, at their certificates of occupancy, and the city sets the targets again in five years.