What changes on January 1
New York voters created the Affordable Housing Fast Track in November 2025, when Ballot Question 2 passed with 58.5 percent of the vote and added section 197-f to the City Charter. On October 1, 2026, the Department of City Planning published the 12 community districts it applies to. From January 1, 2027, a rezoning for housing in any of them can take a shorter road than the standard land-use review, known as ULURP.
The Community Board keeps its 60 days, but the Borough President now reviews at the same time rather than after it. The City Planning Commission then has 30 days, 45 when a project needs an environmental impact statement, and its vote is final. The application is never filed with the City Council, so there is no Council vote and no mayoral veto.
- 60Community Board
- 30Borough President
- 60City Planning Commission
- 50City Council
- 5Mayor
- 60Community Board and Borough President, at the same time
- 30City Planning Commission: the final vote
To qualify, an application has to be in one of the 12 districts, City Planning has to certify that its primary purpose is housing, and it has to carry affordability at Mandatory Inclusionary Housing levels or deeper, generally 20 to 30 percent of the residential floor area. The fast track covers applications filed from January 1, 2027 to December 31, 2031, and the list is drawn again every five years.
Why these 12
The city’s rule is a rate. For each of the 59 community districts, City Planning counted the new affordable homes started between July 1, 2021 and June 30, 2026, divided by the homes the district had at the start. A home counts when it has a start date from the Department of Housing Preservation and Development and a building permit; preserved homes don’t count. The 12 districts with the lowest rates are on the list.
Together they added 724 new affordable homes in those five years: 1.1 percent of the city’s 65,777. They are home to 2.1 million people, 24 percent of New Yorkers in the 2020 Census. All 12 together built fewer than the median district did on its own (773, in the Financial District and Tribeca). East New York alone added 5,794.
All 59 districts as a table
| Rank | District | New affordable homes | Per 1,000 homes |
|---|---|---|---|
| 1 | BK10 Bay Ridge, Dyker Heights | 3 | 0.1 |
| 2 | SI3 South Shore: Tottenville, Great Kills | 4 | 0.1 |
| 3 | QN13 Queens Village, Rosedale, Bellerose | 9 | 0.1 |
| 4 | QN10 Ozone Park, Howard Beach | 7 | 0.2 |
| 5 | SI2 Mid-Island: New Springville, Willowbrook | 23 | 0.4 |
| 6 | BK18 Canarsie, Flatlands | 49 | 0.7 |
| 7 | MN8 Upper East Side, Roosevelt Island | 150 | 1.1 |
| 8 | QN5 Ridgewood, Maspeth, Middle Village | 76 | 1.1 |
| 9 | QN11 Bayside, Little Neck, Douglaston | 52 | 1.1 |
| 10 | MN7 Upper West Side | 152 | 1.2 |
| 11 | BK12 Borough Park, Kensington | 94 | 1.5 |
| 12 | QN4 Elmhurst, Corona | 105 | 1.8 |
| 13 | BK11 Bensonhurst, Bath Beach | 138 | 1.9 |
| 14 | QN9 Kew Gardens, Woodhaven, Richmond Hill | 105 | 2.1 |
| 15 | QN8 Fresh Meadows, Hillcrest | 132 | 2.2 |
| 16 | BK15 Sheepshead Bay, Gravesend | 151 | 2.2 |
| 17 | MN5 Midtown | 111 | 2.6 |
| 18 | MN6 Murray Hill, Gramercy, Stuyvesant Town | 265 | 2.7 |
| 19 | MN2 Greenwich Village, SoHo | 204 | 3.5 |
| 20 | BX10 Throgs Neck, Co-op City | 270 | 4.9 |
| 21 | QN3 Jackson Heights, North Corona | 309 | 5.2 |
| 22 | SI1 St. George, Stapleton | 395 | 5.7 |
| 23 | BK7 Sunset Park, Windsor Terrace | 270 | 5.9 |
| 24 | MN9 Morningside Heights, Hamilton Heights | 312 | 6.9 |
| 25 | MN3 Lower East Side, Chinatown | 663 | 8.0 |
| 26 | BK14 Flatbush, Midwood | 538 | 8.5 |
| 27 | QN6 Forest Hills, Rego Park | 546 | 9.6 |
| 28 | MN10 Central Harlem | 644 | 10.3 |
| 29 | BX11 Morris Park, Bronxdale | 533 | 11.9 |
| 30 | QN7 Flushing, Whitestone | 1,234 | 11.9 |
| 31 | MN4 Chelsea, Hell's Kitchen | 1,198 | 14.1 |
| 32 | BK17 East Flatbush, Farragut | 1,000 | 15.7 |
| 33 | MN11 East Harlem | 896 | 16.1 |
| 34 | QN1 Astoria, Long Island City | 1,618 | 17.8 |
| 35 | MN1 Financial District, Tribeca | 773 | 18.3 |
| 36 | BK4 Bushwick | 882 | 18.3 |
| 37 | BX9 Parkchester, Soundview | 1,293 | 18.7 |
| 38 | BX8 Riverdale, Fieldston | 849 | 18.8 |
| 39 | MN12 Washington Heights, Inwood | 1,438 | 19.2 |
| 40 | BK8 Crown Heights, Prospect Heights | 969 | 19.5 |
| 41 | BK3 Bedford-Stuyvesant | 1,608 | 21.7 |
| 42 | BX12 Williamsbridge, Baychester | 1,529 | 25.0 |
| 43 | BK1 Greenpoint, Williamsburg | 2,563 | 28.1 |
| 44 | QN12 Jamaica, Hollis | 2,466 | 28.9 |
| 45 | QN2 Sunnyside, Woodside | 2,064 | 32.5 |
| 46 | BK13 Coney Island, Brighton Beach | 1,657 | 35.4 |
| 47 | BK9 South Crown Heights, Lefferts Gardens | 1,570 | 37.4 |
| 48 | BK6 Park Slope, Carroll Gardens | 2,022 | 37.9 |
| 49 | BX3 Morrisania, Crotona | 1,323 | 38.1 |
| 50 | BK2 Downtown Brooklyn, Fort Greene | 2,758 | 40.2 |
| 51 | BX7 Kingsbridge Heights, Bedford | 2,362 | 44.1 |
| 52 | BX2 Hunts Point, Longwood | 973 | 48.9 |
| 53 | QN14 The Rockaways, Broad Channel | 2,738 | 56.9 |
| 54 | BX6 Belmont, East Tremont | 1,949 | 57.8 |
| 55 | BK16 Brownsville, Ocean Hill | 2,697 | 71.5 |
| 56 | BX4 Highbridge, Concourse | 4,125 | 75.3 |
| 57 | BK5 East New York, Starrett City | 5,794 | 77.8 |
| 58 | BX1 Mott Haven, Melrose | 3,061 | 79.6 |
| 59 | BX5 Fordham, University Heights | 4,058 | 88.0 |
The 12 districts
From the lowest rate up. Lots are privately owned vacant lots and parking lots of 5,000 square feet or more.
| District | New affordable homes, 2021–26 | Per 1,000 homes | Residents, 2020 | Lots |
|---|---|---|---|---|
| BK10Bay Ridge, Dyker HeightsBrooklyn | 3 | 0.1 | 136,071 | 26 |
| SI3South Shore: Tottenville, Great KillsStaten Island | 4 | 0.1 | 164,723 | 780 |
| QN13Queens Village, Rosedale, BelleroseQueens | 9 | 0.1 | 199,218 | 179 |
| QN10Ozone Park, Howard BeachQueens | 7 | 0.2 | 129,411 | 73 |
| SI2Mid-Island: New Springville, WillowbrookStaten Island | 23 | 0.4 | 140,795 | 422 |
| BK18Canarsie, FlatlandsBrooklyn | 49 | 0.7 | 204,095 | 123 |
| MN8Upper East Side, Roosevelt IslandManhattan | 150 | 1.1 | 231,983 | 27 |
| QN5Ridgewood, Maspeth, Middle VillageQueens | 76 | 1.1 | 178,178 | 118 |
| QN11Bayside, Little Neck, DouglastonQueens | 52 | 1.1 | 122,211 | 129 |
| MN7Upper West SideManhattan | 152 | 1.2 | 222,129 | 18 |
| BK12Borough Park, KensingtonBrooklyn | 94 | 1.5 | 205,377 | 49 |
| QN4Elmhurst, CoronaQueens | 105 | 1.8 | 181,025 | 34 |
| All 12 | 724 | 0.8 | 2,115,216 | 1,978 |
The Upper West and Upper East Sides
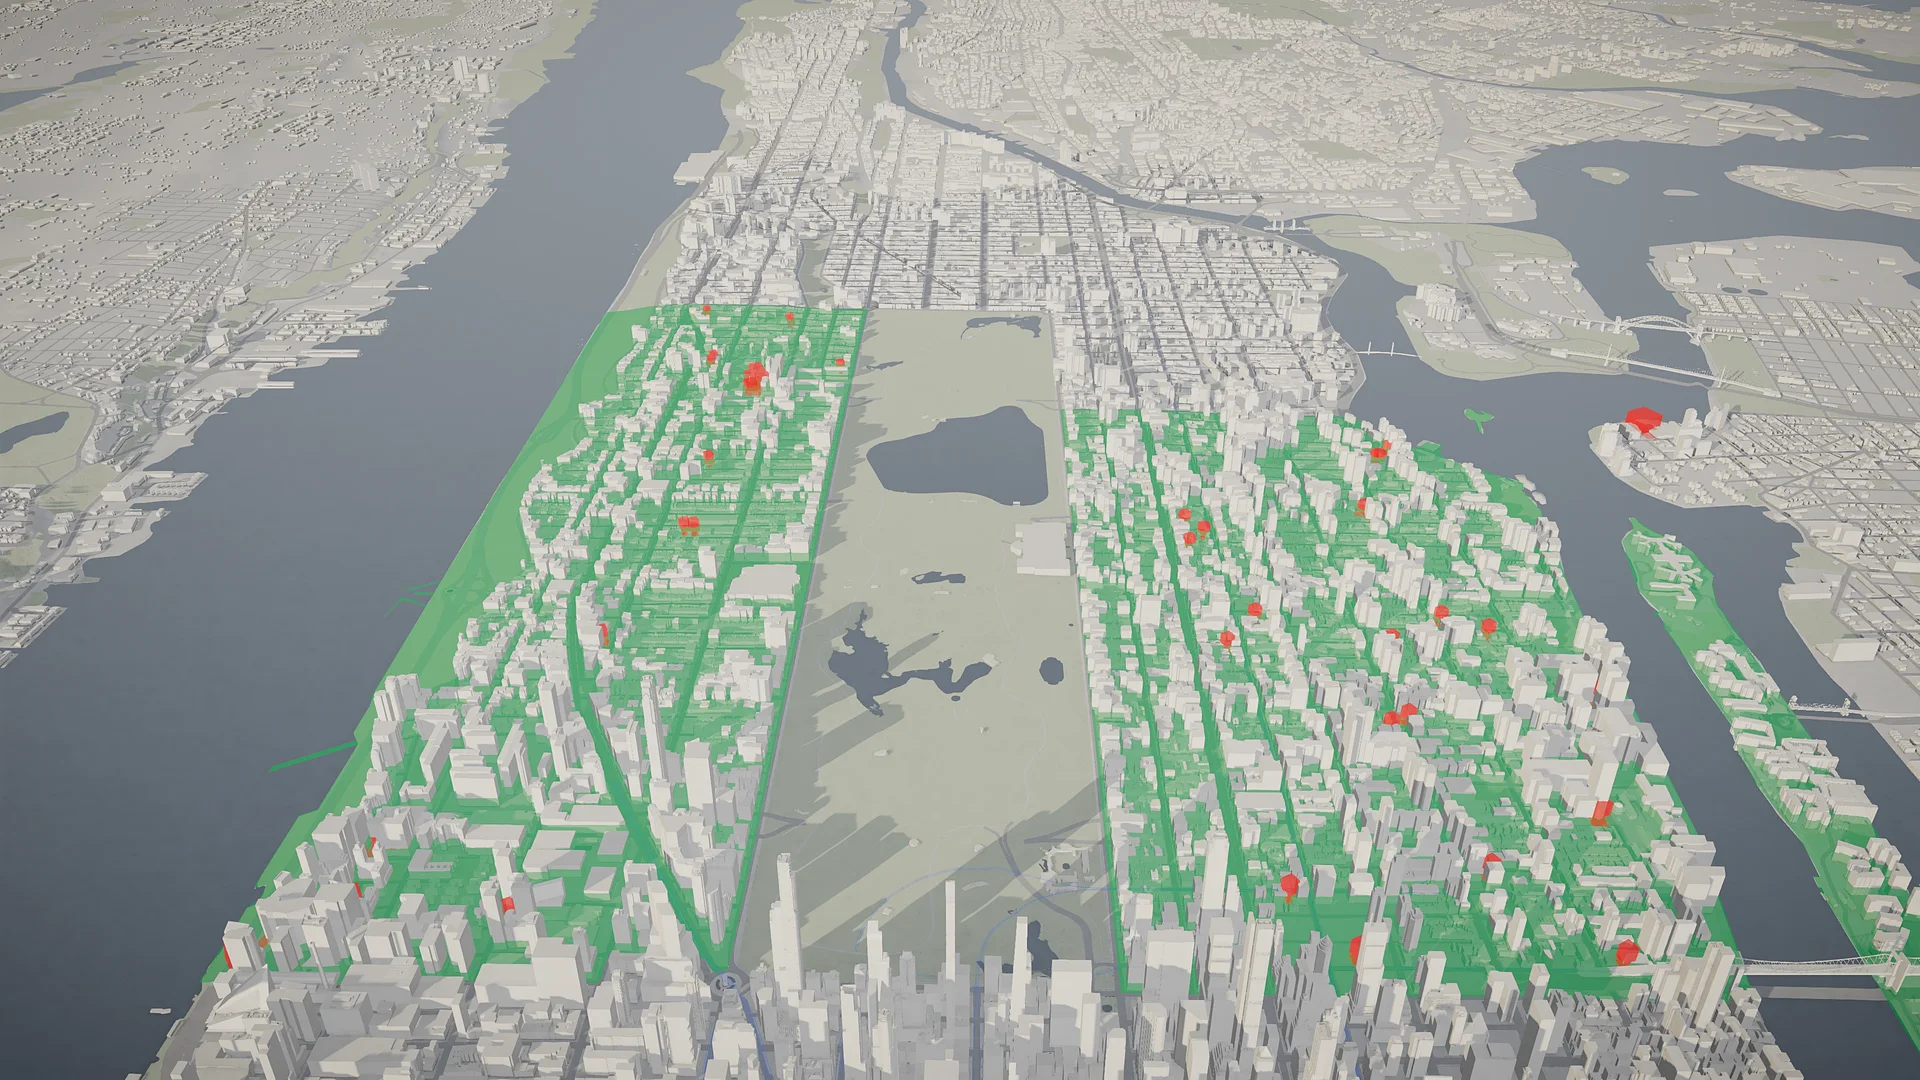
Manhattan’s two districts on the list have the most homes of any on it: 126,466 on the Upper West Side and 139,461 on the Upper East Side and Roosevelt Island. Between them they added 302 new affordable homes in five years, and each added more than any of the other ten districts on the list. Measured against their size, they rank seventh and tenth from the bottom.
Ranked by count instead of rate, both would come off the list, and Midtown and Kew Gardens–Woodhaven would take their places. Council Member Gale Brewer, who represents the Upper West Side, has said she does not support the fast track and has asked for the district to be taken off the list.
Where the land is
Inside the 12 districts are 1,978 privately owned vacant lots and parking lots of 5,000 square feet or more, 1,644 acres in all, according to PLUTO, the city’s tax-lot database. Most of that land is on Staten Island: its two districts hold 1,202 of the lots and about 1,400 of the 1,644 acres. Manhattan’s two hold 45 lots on 14 acres.
| Borough | Lots | Acres |
|---|---|---|
| Staten Island2 districts | 1,202 | 1,400 |
| Queens5 districts | 533 | 151 |
| Brooklyn3 districts | 198 | 80 |
| Manhattan2 districts | 45 | 14 |
Privately owned is the filter that matters. By area, most of the vacant land in these districts is public: the State’s underwater lot in the Hudson off the Upper West Side, a 530-acre city parcel on Flatbush Avenue in Canarsie, state wetlands and parkland on Staten Island, Sanitation land. None of it is a housing site, so none of it is counted here.
A typical case: 58-17 Junction Boulevard in Elmhurst, a 74,415-square-foot parking lot zoned C4-4, where today’s zoning allows a residential floor area ratio of 3.44. On the model, every lot opens to the same card: its size, its zoning, and the floor area its zoning allows today.
Vacant and parking are PLUTO’s land-use codes, so some lots will have changed since: a construction start, a sale. The floor area a lot’s zoning allows is its maximum residential floor area ratio times its area, before bonuses; it is a sketch, not a buildable-area study.
What it doesn’t do
The fast track changes the path an application takes, not what any lot is zoned for. Every project still needs its own rezoning, applied for and approved, and it still goes through environmental review where that applies, with landmark protections in place.
“It does not mandate housing. It does not automatically rezone.”
It is also separate from the other housing changes voters approved the same day: a fast track at the Board of Standards and Appeals for publicly financed affordable housing anywhere in the city, an expedited review for modest rezonings citywide, and a new Affordable Housing Appeals Board.